News
- February 25, 2015:
- UPDATE: Evolve & Conquer: Teaching evolution via an engaging video game
- Computing a football season
- Arend’s Job Description – The Big Question
- Intelligence With Representations
December 20, 2013:
June 27, 2013:
May 16, 2013:
Search
at Michigan State University
Markov Network Brains
In a general sense, a Markov Network Brain (MNB) implements a probabilistic finite state machine, and as such is a Hidden Markov Model (HMM). MNBs act as controllers and decision makers for agents that interact with an environment and agents within the environment. Thus, a MNB can be thought of as an artificial brain for the agent it controls. Similar to the input and output layer of an artificial neuronal network (ANN), a MNB is composed of a set of input nodes (i.e., sensors) and output nodes (i.e., actuators), except that all nodes of a MNB are binary, i.e., the nodes can only be in one of two states: 0 or 1. In addition, a MNB contains a set of hidden nodes, which act as memory for the MNB to store information in.
We have a stable implementation of MNBs on github: https://github.com/dknoester/ealib
How Markov Network Brains Function
When we embed agents with MNBs into an environment and provide it sensorial inputs, these inputs are written into the MNB input nodes. Once provided with inputs, we activate MNB and all nodes pass information through the MNB by updating their states. While input nodes are usually overridden by sensory information from the environment at the beginning of the next brain activation, hidden nodes and output nodes are of particular interest, and their states depend on the particular configuration of the MNB. Hidden nodes can be thought of as the memory of the agent or a mechanism to represent an internal state, whereas output nodes determine the action of the agent for that particular point in time. In most cases, the output nodes encode a finite set of actions. For example, two output nodes can be used to steer a tank, according to the output sets in Table 1.
| Output A | Output B | Encoded Action |
|---|---|---|
| 0 | 0 | Stay still |
| 1 | 1 | Move forward |
| 0 | 1 | Turn right |
| 1 | 0 | Turn left |
Table 1: Example agent action encoding with two output nodes. Each output combination encodes a discrete action taken by the agent.
Arbitrary encodings can be used, but simpler encodings are more conducive to the evolution of effective behavior. In order for agent to be able to react to the environment, the output nodes must somehow connect to the input nodes, and if memory is required for more complex tasks, the output nodes must also depend on the states of hidden nodes. Consequently, hidden nodes might also depend on the input nodes. In a MNB, node states are updated by probabilistic logic gates (PLG), also known as a Hidden Markov Gates, which function similar to classic logic gates (e.g., AND, NAND, OR, or XOR). A classic logic gate, e.g. XOR, reads binary states from two input nodes and updates a single output node according to the XOR logic. Alternatively, a classic logic gate can be described with a probability table that maps each possible input to a probability distribution of its outputs. In the case of a XOR gate, there are four possible input sets (00, 01, 10, and 11) and two possible outputs (0 or 1). Table 2 shows the equivalent probability table of an XOR gate.
| Input A | Input B | p(0) | p(1) |
|---|---|---|---|
| 0 | 0 | 1.0 | 0.0 |
| 0 | 1 | 0.0 | 1.0 |
| 1 | 0 | 0.0 | 1.0 |
| 1 | 1 | 1.0 | 0.0 |
Table 2: Probability table for an XOR gate. The input A and input B columns contain the possible states of the input nodes. p(0) and p(1) are the probabilities that the output nodes is a 0 or 1, respectively, given the corresponding input.

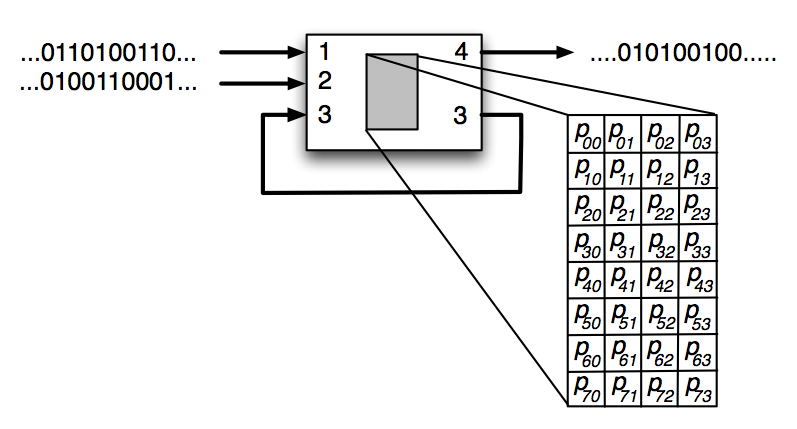
Figure 1: An illustration of a Probabilistic Logic Gate (PLG) with three binary inputs and two binary outputs. The PLG is composed of a 22 x 23 state transition table which encodes the logic for the PLG.
While classic logic gates are deterministic, probabilistic logic gates are composed of arbitrary probabilities in their probability table. Therefore, while the output states still depend on the input states, they can also have a degree stochasticity to their output. Figure 1 illustrates an example PLG, with three binary inputs entering the PLG: 1 and 2 coming from sensory input nodes, while input 3 comes from a hidden node. The PLG is composed of a 22 x 23 state transition table which encodes the logic for the PLG. Once provided with inputs, the PLG activates and updates the states of hidden node 3 and output node 4. Since the PLG outputs to the same hidden node that it receives input from, it is forming a recurrent connection, i.e., memory. The state of output node 4 can encode two possible actions, such as turning left (0) or right (1).

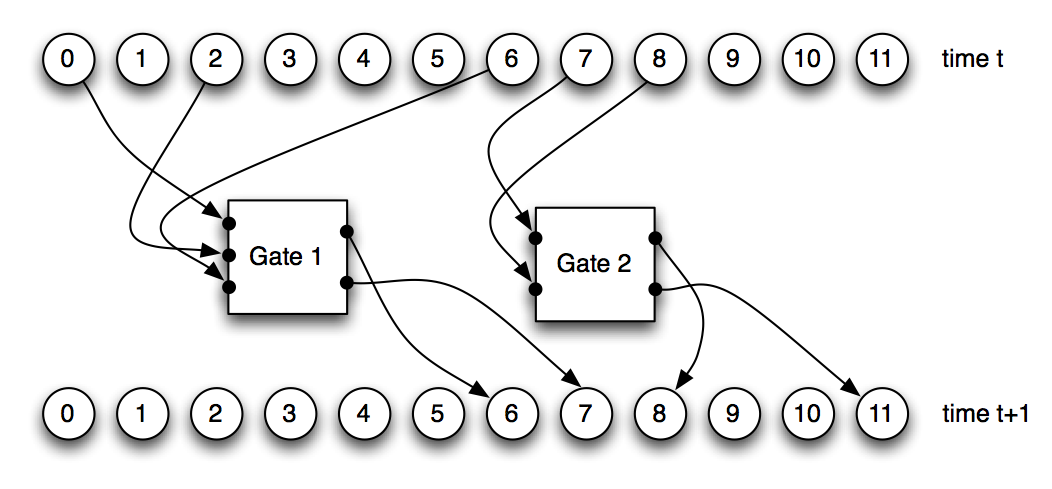
Figure 2: A Markov Network Brain composed of 12 nodes and two Probabilistic Logic Gates (PLGs). Once the nodes at time t pass binary information into the PLGs, the PLGs activate and update the states of the nodes at time t+1.
The PLGs we implemented in this model can receive input from a maximum of four nodes, and write into a maximum of four nodes, with a minimum of one input and one output node for each PLG. Any node (input, output, or hidden) in the MNB can be used as an input or output for a PLG. MNBs are composed of an arbitrary number of PLGs, and the PLGs are what define the internal logic of the MNB. Thus, to evolve a MNB, mutations change the connections between nodes and PLGs, and modify the probabilistic logic tables that describe each PLG. Figure 2 demonstrates a MNB with 12 nodes connecting to 2 PLGs, and how these two PLGs affect the states of the nodes they write into after one brain activation.
It is possible for two or more PLGs to write into a single node, and each PLG likely has a different value it wants to place in the common node. This conflict is resolved by using an OR function on the values entering the common node. Thus, whenever one PLG writes a 1 into a node with multiple inputs, that node becomes 1 regardless of the inputs from other PLGs.
Genetic Encoding of Markov Network Brains
We use a circular string of bytes as a genome, which contains all the information to describe a MNB. The genome is composed of it genes, and each gene encodes a single PLG. Therefore, a gene contains the information about which nodes the PLG reads input from, which nodes the PLG writes in to, and the probability table defining the logic of the PLG. The start of a gene is indicated by a start codon, which is represented by the sequence (42, 213) in the genome. The specific sequence we chose to represent the start codon is arbitrary; we chose 42 as a tribute to Douglas Adams, and 213 is 255 (the maximum value of a byte) minus 42.

Figure 3: Example circular byte strings encoding two Probabilistic Logic Gates (PLGs), denoted Gene 1 and Gene 2. The sequence (42, 213) represents the beginning of a new PLG (red blocks). The next two bytes encode the number of input and output nodes used by the PLG (green blocks), and the following eight bytes encode which nodes are used as input (blue blocks) and output (yellow blocks). The remaining bytes in the string encode the probabilities of the PLG’s logic table (cyan blocks).
Figure 3 provides an example genome. After the start codon, the next two numbers describe the number of inputs (Nin) and outputs (Nout) used in this gate, where each N is defined by the equation:
![]()
where number is the byte number in the genome string. In this case, Nmax = 4.
The following Nmax numbers of the gene specify which nodes the PLG reads from by mapping to a node ID number with the equation:
![]()
where number is the byte number in the genome string, # nodes is the number of nodes in the MNB, and ![]() denotes the nearest integer.
denotes the nearest integer.
Similarly, the next Nmax numbers encode which nodes the PLG writes to with the same equation as Nin. If too many inputs or outputs are specified, the remaining sites in that section of the gene are ignored, designated by the # signs.
The following 2Nin + Nout numbers of the gene expresses the probabilities composing the 2Nin x 2Nout logic table. We sequentially fill the logic table row-by-row with numbers from the genome. Once the logic table is filled, we convert the gene numbers into the corresponding probabilities (pij) with the equation:

where numberij is the byte number in the probability table at index [i, j].
Since we use bytes to specify the values in the table, the rows of the probability table are normalized to 1.0. We apply the modulo operator on the number of inputs and outputs as well as the IDs of the nodes used as inputs and outputs in order to keep them within the allowed ranges.
The number of nodes allowed and which nodes are used as inputs and outputs are specified as constants by the user. Combined with these constants, the genome described above unambiguously defines a MNB. All evolutionary changes such as point mutations, duplication, deletions, or cross over are performed on the genome, and only take effect after the genome is translated into a MNB. Thus, the MNB can be thought of the phenotype expressed by the genome.

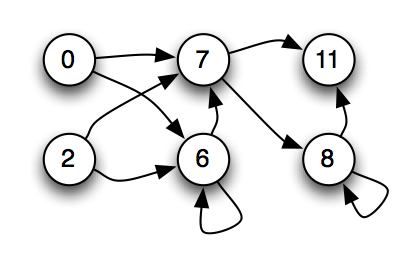
Figure 4: A causal graph of the node connections for a Markov Network Brain (MNB). The only nodes displayed are nodes that provide input to or receive output from the Probabilistic Logic Gates of the MNB. Arrows between the nodes indicate the flow of binary information between the nodes.
MNBs can be visualized in several ways. Since the visualization of the MNB in Figure 2 is somewhat inconvenient, and the gates are less important than how nodes depend causally on each other, we usually only display a graph similar to Figure 4 showing the causal relations between the nodes.
Markov Network Brain FAQ
Can genes overlap?
Yes, a 42 followed by a 213 defines a start codon. Whenever a start codon is found, the subsequent bytes are used to define a new PLG as well as the remainder of the current PLG. As a consequence of this overlap, a single point mutation can affect multiple genes. This kind of gene overlap is commonly observed in nature.
Why not use 0 and 255 as start codons?
In prior experiments, we observed that the probabilities in a gene tend to converge on 0 or 255, making the PLGs more deterministic. Therefore, we did not use 0 nor 255 as start codons because an excessive number of genes would end up being encoded.
Is there directionality in the genes?
We read from the beginning of the sequence to the end in one direction. If a gene extends past the end of the genome byte string, we continue reading at the beginning of the byte string again, i.e., the genome is a circular byte string.
Why do you OR the output from PLGs that write into the same node instead of preventing gates from writing into the same node?
We do not want to give one gene priority over another gene. If we excluded genes from writing into the same node, we would be required to prioritize which PLG is allowed to write and which one is disallowed. An intuitive method would be to use the order on the genome, such that a PLG which comes earlier in the genome would have priority over other PLGs. We decided against that method, and instead chose to OR the combined outputs. Other output combination methods are possible as well, such XOR, AND, or even thresholds. We experimented with all of these methods and found OR to be the optimal, without having explicit data to support this.
Since writing into sensors is pointless, why do you allow it?
On a genetic level, we treat input nodes and output nodes the same way, therefore gates can write into the input nodes of the agent. However, the user decides which nodes are used as inputs or outputs. When we translate a genome into a MNB, we don’t explicitly know which nodes are inputs and outputs, therefore we allow gates to write into nodes that are designated as inputs. After the brain is activated, sensorial inputs from the environment override anything the gates might have written into them anyway.
Why do you allow gates to read from actuator?
Human brains can sense what its muscles are doing and what angle its joints are at, therefore we see no reason to disallow a MNB from doing this as well.
References
J. Edlund, N. Chaumont, A. Hintze, C. Koch, G. Tononi, and C. Adami. Integrated Information Increases with Fitness in the Evolution of Animats. PLoS Comp. Biol. 7 (2011) e1002236.
L. Marstaller, A. Hintze, and C. Adami, The Evolution of Representation in Simple Cognitive Networks. Neural Computation 25 (2013) 2079-2105. [Journal]
R. S. Olson, A. Hintze, F. C. Dyer, D. B. Knoester, C. Adami. Predator Confusion is Sufficient to Evolve Swarming Behavior, Journal of the Royal Society Interface 10 (2013) 20130305. [Journal] [PDF]
R. S. Olson, D. B. Knoester, and C. Adami. Critical Interplay Between Density-dependent Predation and Evolution of the Selfish Herd. Proceedings of GECCO 2013, pp. 247-254. [Proceedings] [PDF]
S. D. Chapman, D. B. Knoester, A. Hintze, and C. Adami. Evolution of an artificial visual cortex for image recognition. In: “Advances in Artificial Life (ECAL 2013)” (P. Liò, O. Miglino, G. Nicosia, S. Nolfi and M. Pavone, eds.) MIT Press (2013) pp. 1067-1074. [Proceeedings] [PDF]
N. J. Joshi, G. Tononi, and C. Koch C. The Minimal Complexity of Adapting Agents Increases with Fitness. PLoS Comput Biol 9 (2013) e1003111. doi:10.1371/journal.pcbi.1003111
P.B. Haley, R.S. Olson, F.C. Dyer, and C. Adami. Exploring Conditions that Select for the Evolution of Cooperative Group Foraging. Proceedings of Artificial Life 14 (H. Sayama, J. Rieffel, S. Risi, R. Doursat and H. Lipson, eds.) MIT Press, Cambridge, MA (2014) pp.310-311. [Proceedings]
L. Albantakis, A. Hintze, C. Koch, C. Adami, and G. Tononi, Evolution of Integrated Causal Structures in Animats Exposed to Environments of Increasing Complexity. PLoS Comp. Biol. 10 (2014) e1003966 [Journal].
R.S. Olson, P.B. Haley, F.C. Dyer, and C. Adami, Exploring the Evolution of a Trade-off Between Vigilance and Foraging in Group-living Organisms. Royal Society open sci. 2 (2015) 150135. [arXiv]
P. Kvam, J. Cesario, J. Schossau, H. Eisthen, and A. Hintze, Computational Evolution of Decision-Making Strategies. In: D.C. Noelle, R. Dale, A.S. Warlaumont, J. Yoshimi, T. Matlock, C.D. Jennings, & P.P. Maglio (eds.), Proceedings of the 37th Annual Conference of the Cognitive Science Society (pp. 1225-1230). Austin, TX: Cognitive Science Society. [PDF]
R. S. Olson, D. B. Knoester, and C. Adami. Evolution of Swarming Behavior is Shaped By How Predators Attack. [arXiv] Artificial Life, in review.
J. Schossau, C. Adami, and A. Hintze, Information-theoretic Neuro-correlates Boost Evolution of Cognitive Systems. Entropy, in review.
A. Hintze, F. Bartlett, and F. Dyer. Evolution of Resetting Behavior in Foraging Animats. Royal Society Interface (in review).
[…] then used artificial neuronal networks (ANNs) and Markov networks to evolve controllers to solve this task. While there are no marked differences between those two […]
[…] In a general sense, a Markov Network Brain (MNB) implements a probabilistic finite state machine, and as such is a Hidden Markov Model (HMM). MNBs act as controllers and decision makers for agents … […]
[…] Chris Adami of Michigan State and his colleagues decided to overcome these hurdles–of observing evolution and measuring information precisely–by programming a swarm of artificial creatures which they dubbed animats. […]
[…] Chris Adami of Michigan State and his colleagues designed and created a complex system that has the property of being easy to access for study purposes, to observe the behaviour and evolution of such systems. They did it by writing a program which generates a swarm of artificial, virtual organisms which they called animats. […]
[…] then used artificial neural networks (ANNs) and Markov networks to evolve controllers to solve this task. While there are no marked differences between those two […]
[…] (allowing them to interact with their environment), and hidden nodes, which store information (see http://adamilab.msu.edu/markov-network-brains/ for more information on MNBs). Over the course of rapid evolution, the structure of the MNB […]
[…] http://adamilab.msu.edu/markov-network-brains/ […]
[…] are encoded networks composed of multiple probabilistic logic gates (more information in here: http://adamilab.msu.edu/markov-network-brains/), I was able to evolve controllers for line following robots in order to make them adaptive to […]